data · 2024
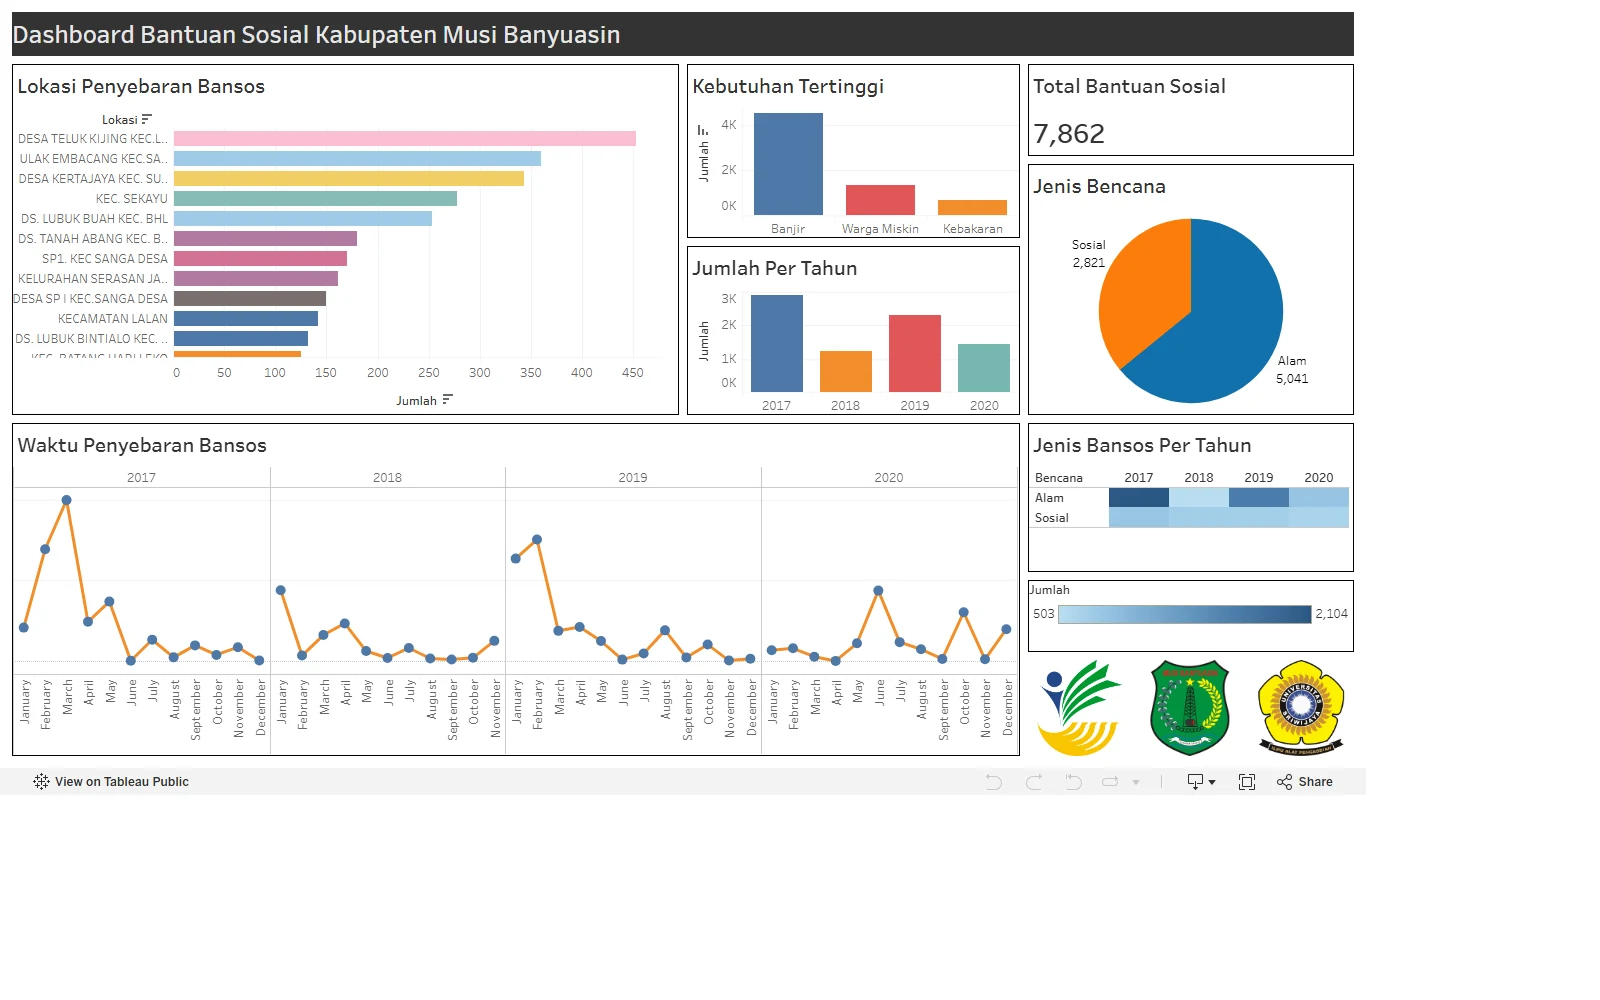
Aid Distribution Dashboard
Data preparation and dashboard build
- Tableau
- Excel
Summary
A public-transparency dashboard for social aid distribution in Musi Banyuasin Regency, built in Tableau on data prepared in Excel.
Problem
Aid distribution data existed but was not readable by the people it described. The goal was a view a non-analyst could interpret without a briefing.
Approach
Clean and reshape the source data in Excel, then model it in Tableau around the questions a reader actually asks: where the aid went, to how many households, and how that compares across areas.
Outcome
An interactive dashboard published for public viewing.
Honest limitations
The dashboard reflects the source data as supplied at the time. It is not a live feed.
Gallery
Next project
watsonx.ai Generative AI App